作者:邬书豪,车联网数据挖掘工程师 ,R语言中文社区专栏作者,R语言中文社区负责人之一。微信ID:wsh137552775
知乎专栏:https://www.zhihu.com/people/wu-shu-hao-67/activities
第一篇请戳:kaggle:R可视化分析金拱门餐厅食物营养性(一)
公众号后台回复“金拱门”下载数据集。
#比较不同的脂肪率(类别=牛肉和猪肉 & 鸡肉和鱼)(图1)#items=(category= Beef & Park
& Chicken & Fish)#Fats=(Total Fat (% Daily Value),Saturated Fat
(% Daily Value),Trans Fat)m1<-menu%>%filter(Category %in% c("Beef
& Pork","Chicken &
Fish"))%>%arrange(desc(Total.Fat....Daily.Value.,Saturated.Fat....Daily.Value.,Trans.Fat))p4
<- plot_ly(m1, x = ~factor(Item,levels=Item), y =
~Total.Fat....Daily.Value., name = 'Total Fat DV', type = 'scatter',
mode = 'lines+markers', width = 2,color = I('red')) %>% add_trace(y =
~Saturated.Fat....Daily.Value., name = 'Saturated Fat
DV',color=I('blue')) %>% add_trace(y = ~Trans.Fat, name = 'Trans
Fat',color=I("hotpink")) %>% layout(title = 'Camparing Fat in Items',
xaxis = list(title = "", showgrid = FALSE), yaxis = list(title =
"value", showgrid = FALSE),
legend=list(orientation="r",xanchor="center"))
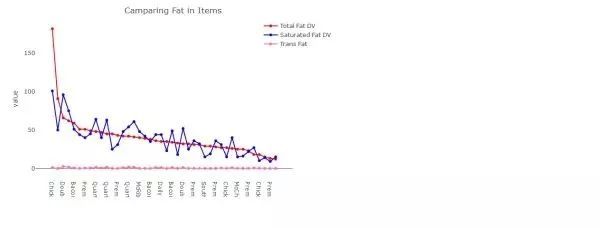
图1:Camparing Fat in Items
Chicken Nuggets排在高脂肪的第一名,其次是Double Quarter Pounder with Cheese,Bacon Clubhouse Burger位居第三。
(类别=牛肉和猪肉 & 鸡肉和鱼)的食物Saturated Fat含量很高!saturated fat 会增加血液胆固醇水平!
#不同食物类别中的钠含量绘图分析(图2)dat<-menu %>%
select(Category,Sodium)%>%
group_by(Category)%>%summarise(tsodium=sum(Sodium))datdat$fraction =
dat$tsodium / sum(dat$tsodium)dat = dat[order(dat$fraction), ]dat$ymax =
cumsum(dat$fraction)dat$ymin = c(0, head(dat$ymax, n=-1))#dat数据 详见图3p5 =
ggplot(dat, aes(fill=Category, ymax=ymax, ymin=ymin, xmax=9, xmin=3)) +
geom_rect() + coord_polar(theta="y") + xlim(c(0, 9)) +
theme(panel.grid=element_blank()) + theme(axis.text=element_blank()) +
theme(axis.ticks=element_blank()) + annotate("text", x = 0, y = 0, label
= "Sodium") + labs(title="Sodium content in Category")p5
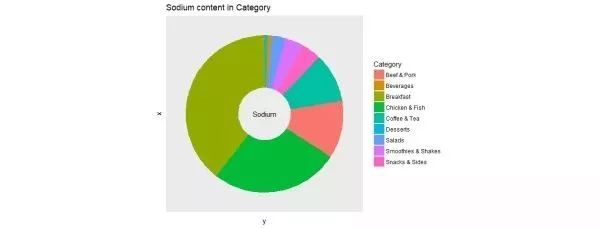
图2:Sodium content in Category
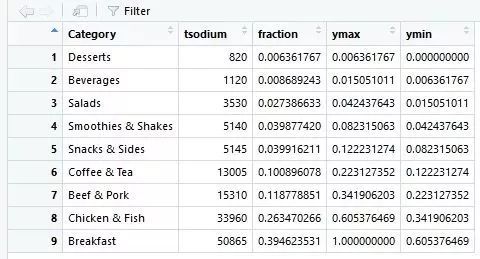
图3:dat数据
Breakfast中占比Sodium(钠)含量占比39%,排名NO.1
Chicken & Fish中Sodium(钠)含量占比26%,排名NO.2
#九种食物类别各自中的Sugars含量是多少?plot_ly(x = menu$Category,
y=menu$Sugars,color = menu$Category,colors =new_col , type = "bar")
%>% layout(title = "Sugars",xaxis = list(title = ""),yaxis =
list(title = ""),showlegend=FALSE,autosize = T)
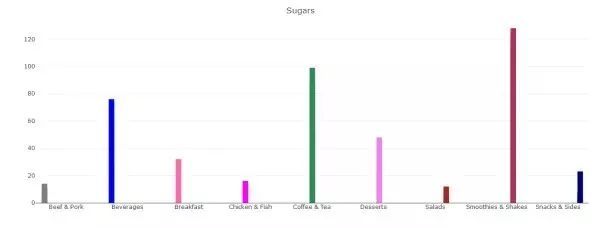
图4:Sugars
Smoothies & Shakes中的Sugars含量最高,排名NO.1
Coffee & Tea中的Sugars含量其次,排名NO.2
#Sugar含量在Smoothies & Shakes这一类食物中的数值可视化绘图(图5)
library(stringr)ss<-menu%>%select(Category,Item,Sugars,Serving.Size,Sugars)%>%filter(Category=="Smoothies
&
Shakes")ss$size<-NULLss$size[str_detect(ss$Item,"Small")]<-"Small"ss$size[str_detect(ss$Item,"Medium")]<-"Medium"ss$size[str_detect(ss$Item,"Large")]<-"Large"ss$size[str_detect(ss$Item,"Snack")]<-"Snack"ss%>%filter(!size
== "Snack")%>%arrange(desc(Sugars))%>% #ss数据
图6ggplot(aes(x=factor(Item,level=Item),y=Sugars,group=size,fill=size))+geom_bar(stat="identity",position="dodge",alpha=0.7)+theme(axis.text.x
= element_text(angle=90))+coord_flip()+labs(x="Item",title="Sugar
content in Smoothies & Shakes")
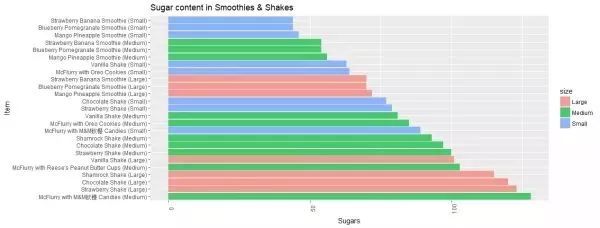
图5:Sugar content in Smoothies & Shake
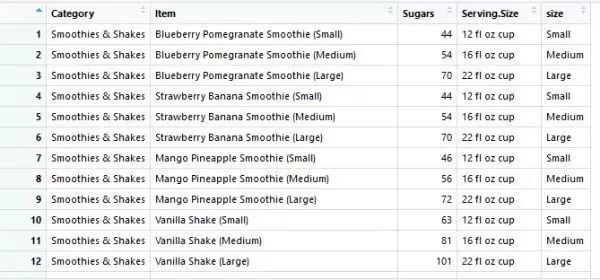
图6:ss数据
#比较胆固醇和胆固醇(每日价值)在各食物名称中含量绘图。(图7)menu %>%
arrange(desc(Cholesterol....Daily.Value.))%>%plot_ly( x =
~factor(Item,levels=Item),y = ~Cholesterol, type="scatter",color=~Item,
size=~Cholesterol,colors='Paired',mode = "markers",marker=list(
opacity=0.7) ) %>% add_trace(x = ~factor(Item,levels=Item), y =
~Cholesterol....Daily.Value., modee="lines", yaxis = "y2", name =
"Cholestrol DV",color=I('red'),line=list(opacity=0.7)) %>%
layout(yaxis2 = list(overlaying = "y",side = "left",title="Cholesterol
DV"),title = "Cholesterol Content",xaxis = list(title = ""),yaxis =
list(title = "Total Cholestrol",side="right"),showlegend=FALSE,autosize =
T,margin = list(pad = 30, b = 90, l = 60, r = 80))
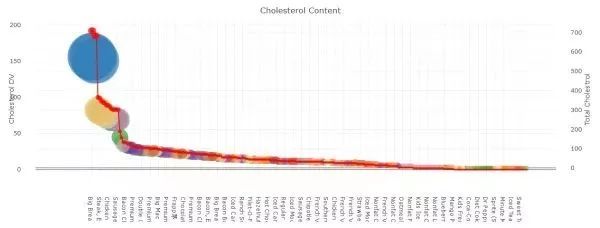
图7:Cholesterol Content
#可视化胆固醇含量高的食物类别(Cholestrol Rich Items)与胆固醇含量低一些的食物类别(Cholestrol Low Items)
ch<-menu %>% select(Category,Item,Cholesterol)%>%
arrange(desc(Cholesterol))%>%head(25)p6<-plot_ly(ch,
x=factor(ch$Item,level=ch$Item),y=ch$Cholesterol,color=ch$Category,type="bar")%>%layout(title="Cholestrol
Rich Items",height=400)ch1<-menu %>%
select(Category,Item,Cholesterol)%>%
arrange(desc(Cholesterol))%>%filter(Cholesterol >5 &
Cholesterol<25)p7<-plot_ly(ch1,
x=factor(ch1$Item,level=ch1$Item),y=ch1$Cholesterol,color=ch1$Category,type="bar")%>%layout(title="Cholestrol
Low Items",height=400)ggplotly(p6) #图8 ggplotly(p7) #图9
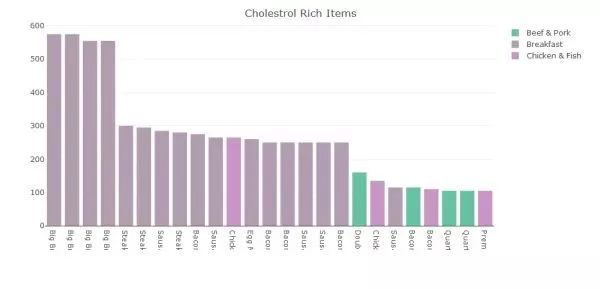
图8:p6(Cholestrol Rich Items)
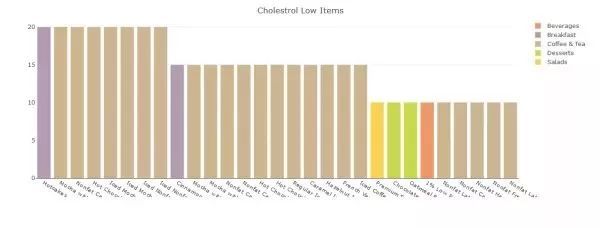
图9:p7(Cholestrol Low Items)
#Dietry Fibre与 Dietary Fiber (% Daily Value)的在各食物中含量绘图(图10)#Dietry
Fibre Content(食物中膳食纤维的数值)menu %>% plot_ly( x = menu$Item, y =
menu$Dietary.Fiber....Daily.Value., type="scatter", mode = "markers"
,marker=list( color=colorRampPalette(brewer.pal(30,"Spectral"))(100) ,
opacity=0.7 ,size=~Dietary.Fiber....Daily.Value.) ) %>% layout(title =
"Dietry Fibre Daily Content ",xaxis = list(title = ""),yaxis =
list(title = "Daily Dietary fibre"),showlegend=FALSE,autosize = F, width
= 1000, height = 400,margin=m)
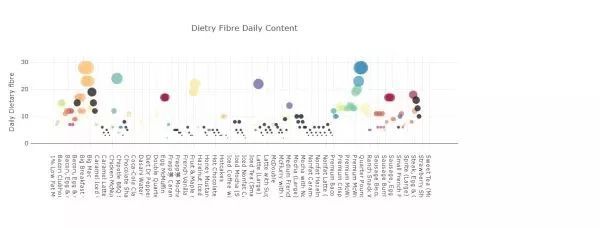
图10:Dietry Fibre Daily Content
#Category(食物类别)中Vitamin
C的含量占比(图11)menu%>%group_by(Category)%>%summarise(vitc=sum(Vitamin.C....Daily.Value.))%>%plot_ly(labels
= ~Category, values = ~vitc) %>%add_pie(hole = 0.3,textinfo =
'label+percent',marker = list(colors = new_col,line = list(color =
'#FFFFFF', width = 1))) %>% layout(title = "Categories & Vitamin C
%",showlegend = F,xaxis = list(showgrid = FALSE, zeroline = FALSE,
showticklabels = FALSE),yaxis = list(showgrid = FALSE, zeroline = FALSE,
showticklabels = FALSE))
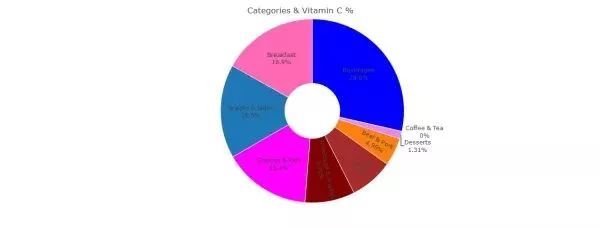
图11:Categories & Vitamin C %
Beverages(饮料)类食物分类中Vitamin C含量在9类食物中占比28.6%,排名NO.1
Breakfast(早餐)这类食物分类中Vitamin C含量在9类食物中占比16.9% , 排名NO.2
#Vitamin C含量最高滴十种食物!(图12)vitc<-menu%>%
select(Item,Vitamin.C....Daily.Value.,Category)%>%group_by(Item,Category)%>%summarise(c=mean(Vitamin.C....Daily.Value.))%>%arrange(desc(c))%>%head(10)p8
<- plot_ly(vitc, labels = ~Item, values = ~c, type = 'pie',textinfo =
'label+percent',textposition='inside',marker = list(colors =
new_col,line = list(color = '#FFFFFF', width = 1))) %>%layout(title =
'Top 10 Items which are rich in Vitamin C',xaxis = list(showgrid =
FALSE, zeroline = FALSE, showticklabels = FALSE),yaxis = list(showgrid =
FALSE, zeroline = FALSE, showticklabels = FALSE))
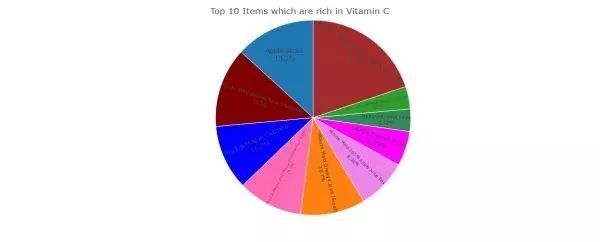
图12:Vitamin C含量最高滴十种食物!
Minute Maid Orange Juice (Large) 含量最高19.8%
Minute Maid Orange Juice (Medium) 和Apple Slices并列第二名 占比13.2%
#各类食物中的铁元素含量(图13)p9 <- plot_ly(menu, r =
~Iron....Daily.Value., t = ~Calories)%>% add_area(color =
~Category)layout(p, radialaxis = list(ticksuffix = "%"), orientation =
270)
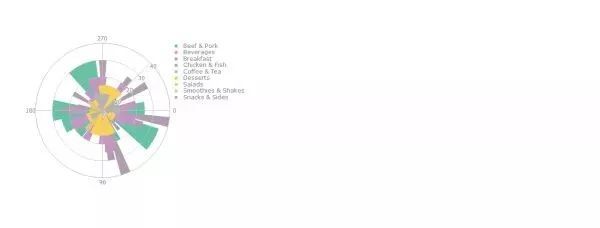
图13
#金拱门食品当中Daily requirement of
Iron的要求。c<-16.3m<-20.5w<-18.9menu %>%
select(Category,Item,Iron....Daily.Value.)%>%arrange(desc(Iron....Daily.Value.))%>%filter(Iron....Daily.Value.>=15)%>%ggplot(aes(x=substr(Item,1,15),y=Iron....Daily.Value.,col=Category,size=Iron....Daily.Value.))+geom_point(fill="red")+theme(axis.text.x
=
element_text(angle=90),legend.position="bottom")+geom_hline(yintercept
=c,col="red",linetype="dashed")+geom_text(aes( 0, c, label =
"Children",vjust=-1,hjust=0,col="red"), size = 3)+geom_hline(yintercept
=m,col="blue",linetype="dashed")+geom_text(aes( 0, m, label =
"Men",vjust=-1,hjust=0), size = 3,col="blue")+geom_hline(yintercept
=w,col="green",linetype="dashed")+geom_text(aes( 0, w, label =
"Women",vjust=-0.5,hjust=0),size = 3,col="green")+labs(title="Mcdonald's
Item -Daily requirement of Iron",x="Item")
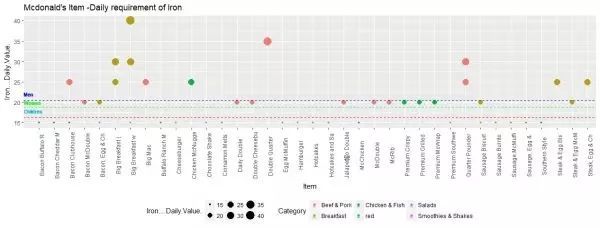
图14
#金拱门食物各属性营养价值占比(图15)menu %>% filter(Item %in% c("Egg
McMuffin","Big Mac","Chicken McNuggets (10 piece)","Large French
Fries","Baked Apple Pie","Double Cheeseburger"))%>%
select(Item,Cholesterol....Daily.Value.,Sodium....Daily.Value.,Carbohydrates....Daily.Value.,Dietary.Fiber....Daily.Value.,Vitamin.A....Daily.Value.,Calcium....Daily.Value.,Iron....Daily.Value.,Total.Fat....Daily.Value.,Saturated.Fat....Daily.Value.)%>%gather(nut,value,2:10)%>%ggplot(aes(x="",y=value,fill=nut))+geom_bar(stat="identity",width=1)+coord_polar(theta
= "y", start=0)+facet_wrap(~Item)+theme(legend.position =
"bottom",legend.text=element_text(size=5))+labs(title="Nutritive values
in most popular items",fill="Nutrients")
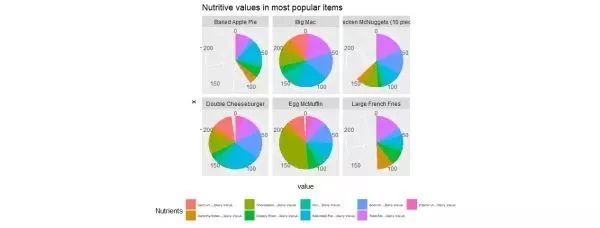
图15:金拱门食物各属性营养价值占比
#有助卡路里的营养成分属性综合分析!(图16)g1<-menu%>%ggplot(aes(x=Cholesterol,y=Calories))+geom_point(col="hotpink")+geom_smooth(method="lm",col="hotpink")g2<-menu%>%ggplot(aes(x=Carbohydrates,y=Calories))+geom_point(col="navyblue")+geom_smooth(method="lm",col="navyblue")g3<-menu%>%ggplot(aes(x=Total.Fat,y=Calories))+geom_point(col="magenta")+geom_smooth(method="lm",col="magenta")g3<-menu%>%ggplot(aes(x=Sugars,y=Calories))+geom_point(col="darkorchid4")+geom_smooth(method="lm",col="darkorchid4")g4<-menu%>%ggplot(aes(x=Protein,y=Calories))+geom_point(col="firebrick4")+geom_smooth(method="lm",col="firebrick4")g5<-menu%>%ggplot(aes(x=Sodium,y=Calories))+geom_point(col="olivedrab4")+geom_smooth(method="lm",col="olivedrab4")g6<-menu%>%ggplot(aes(x=Saturated.Fat,y=Calories))+geom_point(col="orange4")+geom_smooth(method="lm",col="orange4")g7<-menu%>%ggplot(aes(x=Dietary.Fiber,y=Calories))+geom_point(col="tomato4")+geom_smooth(method="lm",col="tomato4")g8<-menu%>%ggplot(aes(x=Trans.Fat,y=Calories))+geom_point(col="slateblue4")+geom_smooth(method="lm",col="slateblue4")grid.arrange(g1,g2,g3,g4,g5,g6,g7,g8,nrow=3,ncol=3)(图16)
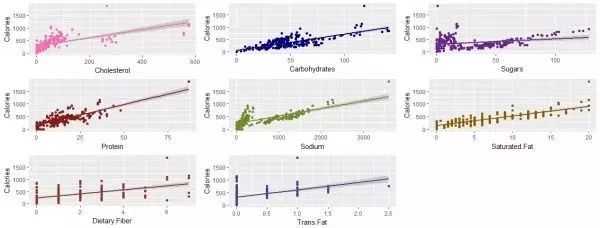
图16:Nutrients contributing to Calories
Sugar,Carbohydrates,Protein,Saturated Fat & cholestrol 对Calories有主要贡献!