【Pheatmap 绘制多分组热图】
热图作为实验数据分布情况的直观展示方法,已经成为高分文章的不错选择,它不仅可以对数据质量进行具像化展示,还可以对数据和样品进行聚类。在R中有多个包均可绘制热图,今天小锐给大家介绍一个可以绘制多个分组热图的R包, libarary(pheatmap)。
首先是准备工作
install.packages("pheatmap")#安装R包
library(pheatmap)#加载R包
data=read.table("for_plot_filter.txt",header=TRUE,row.names=1,sep="t",check.names=F,quote="")#加载数据。

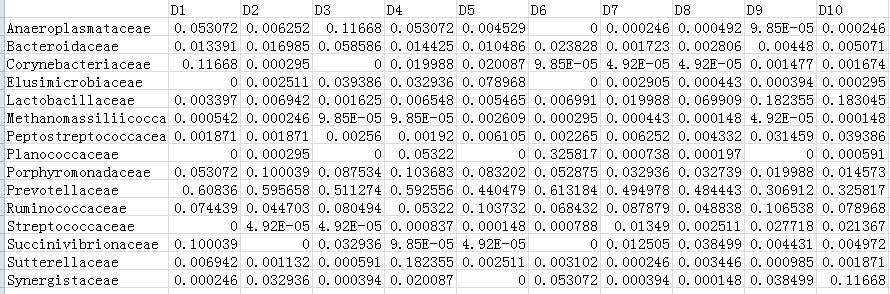
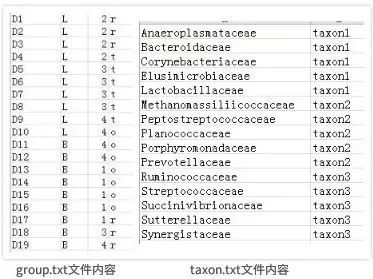
数据文件的示例图

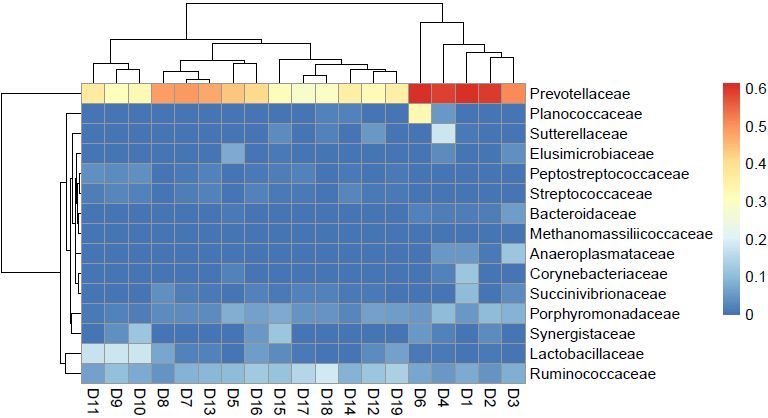
画个基础图形
pheatmap(data,filename = "test.png") #绘制图形,并保存文件。

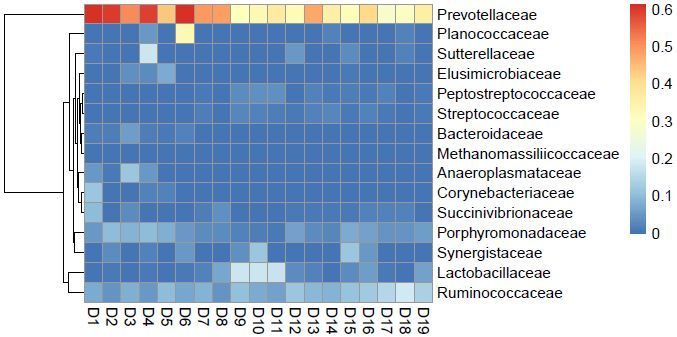
聚类调整
在默认情况下,生成的热图是含有行列聚类,如果不想显示聚类,可加入参数cluster_row = FALSE, cluster_col = FALSE,样品会按照输入顺序进行绘制。
pheatmap(data, cluster_row = TRUE, cluster_col = FALSE,filename = "test.png")#行聚类,列不聚类

绘制单个分组信息
绘制单个分组信息,输入分组信息annotation_col添加列的注释信息。
colgroup=read.table("group.txt",sep="t",header=F,row.names=1,check.names=F,quote="")
colnames(colgroup)=c("Group")#分组文件设置列名
pheatmap(data,annotation_col = colgroup, filename = "test.png")
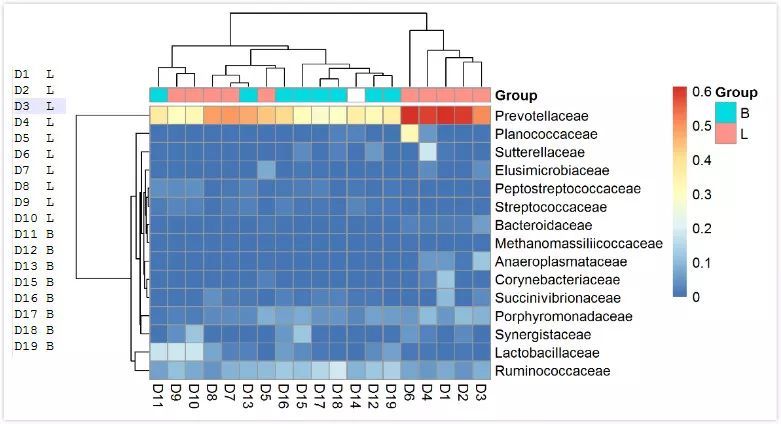

左侧图为分组文件内容

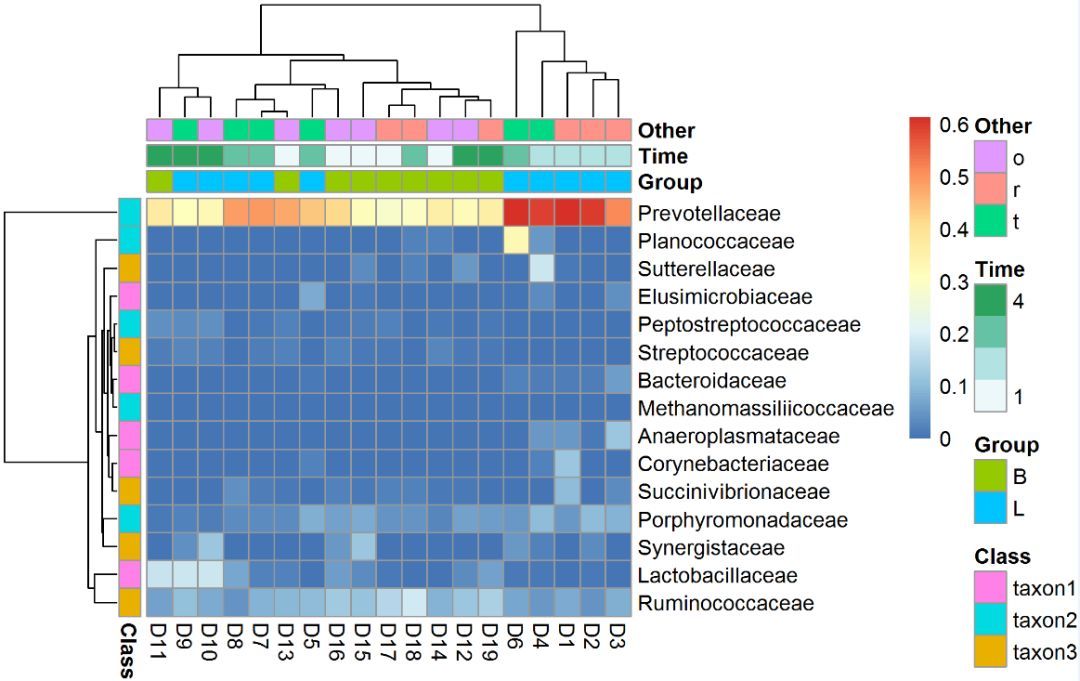
绘制多个分组信息
绘制多个分组信息,annotation_col和annotation_row参数同时添加行和列的注释信息
colgroup=read.table("group.txt",sep="t",header=F,row.names=1,check.names=F,quote="")
rowgroup=read.table("taxon.txt",sep="t",header=F,row.names=1,check.names=F,quote="")
colnames(colgroup)=c("Group","Time","Other")#分组文件设置列名
colnames(rowgroup)=c("Class")
pheatmap(data,annotation_col = colgroup,
annotation_row=rowgroup, filename = "test.png")

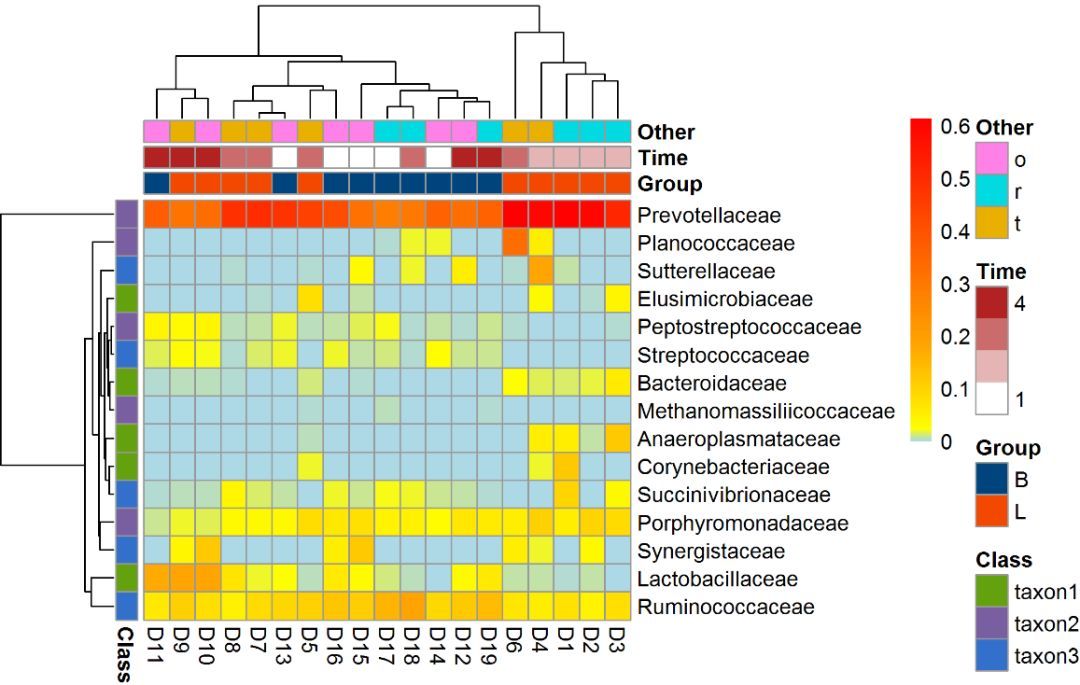
自定颜色列表
利用ann_colors自定注释信息的颜色列表
col = colorRampPalette(c("lightblue", "yellow", "orange", "red"),bias=3)(300)#设置数据颜色
ann_colors = list( Time = c("white", "firebrick"), Group = c(B ="#00447E",L= "#F34800"),
Class = c(taxon1 = "#64A10E", taxon2 = "#795EA2", taxon3 = "#3370CC") )#设置注释信息颜色
pheatmap(data,annotation_col = colgroup, annotation_row=rowgroup,
col=col,annotation_colors = ann_colors, filename = "test.png")

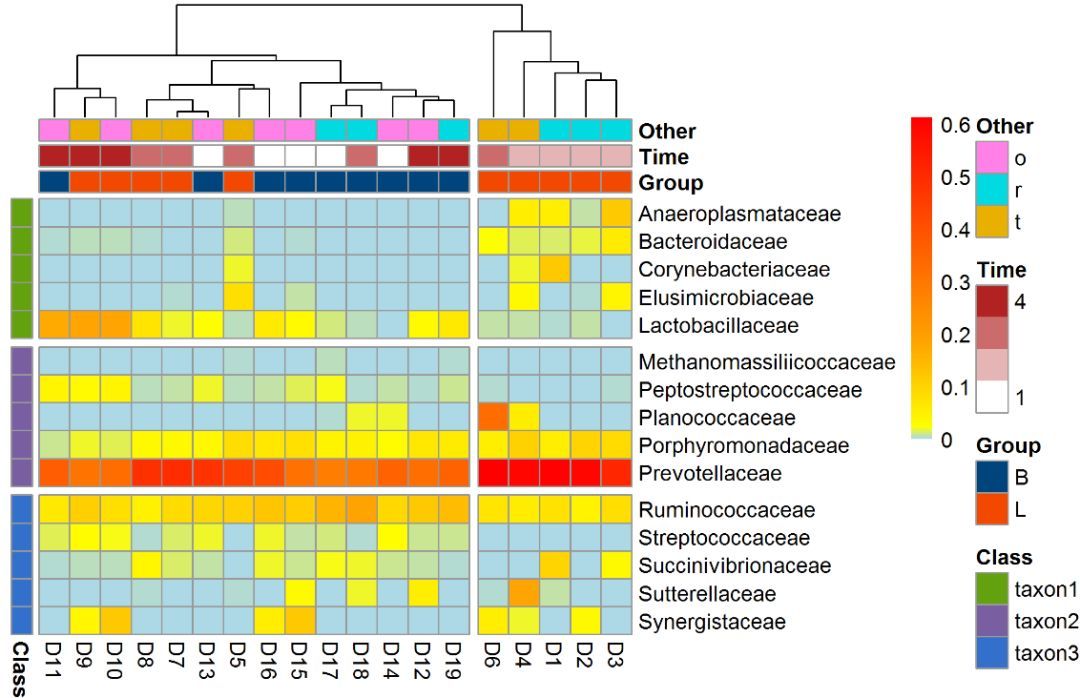
结果分块
利用cutree_col,将列聚类结果分块要求队列聚类,gaps_row参数将行结果分块,要求对行不聚类
pheatmap(data, cluster_row = FALSE, cluster_col = TRUE, annotation_col = colgroup,
annotation_row=rowgroup, col=col, gaps_row = c(5, 10),#在5和10行添加分隔
annotation_colors = ann_colors, cutree_col=2,#聚类结果分成两类
filename = "test.png")

其他参数
sacle: 按照"row”、 "column"或者"none"对数据进行归一化
legend_breaks:设定图例显示范围
legend_labels:设置图例标签
legend = FALSE:去掉图例
annotation_legend = FALSE:去掉注释图例
border_color:设定每个热图格子的边框色
display_numbers = TRUE:设定在每个热图格子中显示相应的数值,
number_color:设置数值字体的颜色
cellwidth和cellheight:设定每个热图格子的宽度和高度
main:添加主标题
fontsize_row 和fontsize_row:设置行名列名文字大小